For my project, I want to create a web of life. Often, humans forget how intact our ecosystem is and how things are connected and rely on one another. A wolf relies on deer, rabbits, and small rodents for food, rabbits rely on vegetation that relies on water and nutrients. When one gets taken away, it throws off the ecosystem, and when two get taken away or decrease, more are affected. Everything is connected.
Species do not disappear on their own, and there are many threats to our biodiversity, Based on the IUCN Red List of Threatened Species, there are 11 top threats to biodiversity including overexploitation, agriculture activity, and urban development. A combination of threats can also affect a single species.
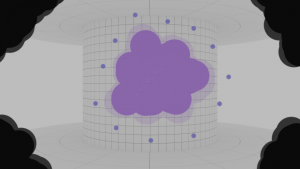
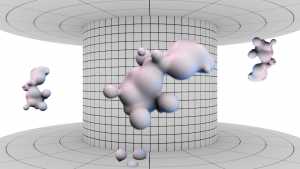
I want to use data visualization to show just how much impact each threat has to species using the IUCN Red List API. The data will be displayed through abstract dynamic 3D shapes. I’m not too sure what set props to use on the spool yet, but I’d like to include interactivity on the spool through buttons or some sort of physical mechanism.
https://www.iucnredlist.org/search
https://www.nature.com/news/biodiversity-the-ravages-of-guns-nets-and-bulldozers-1.20381


